性能压力测试的时候,随着并发压力的增大,系统响应时间和吞吐量如何变化,为什么
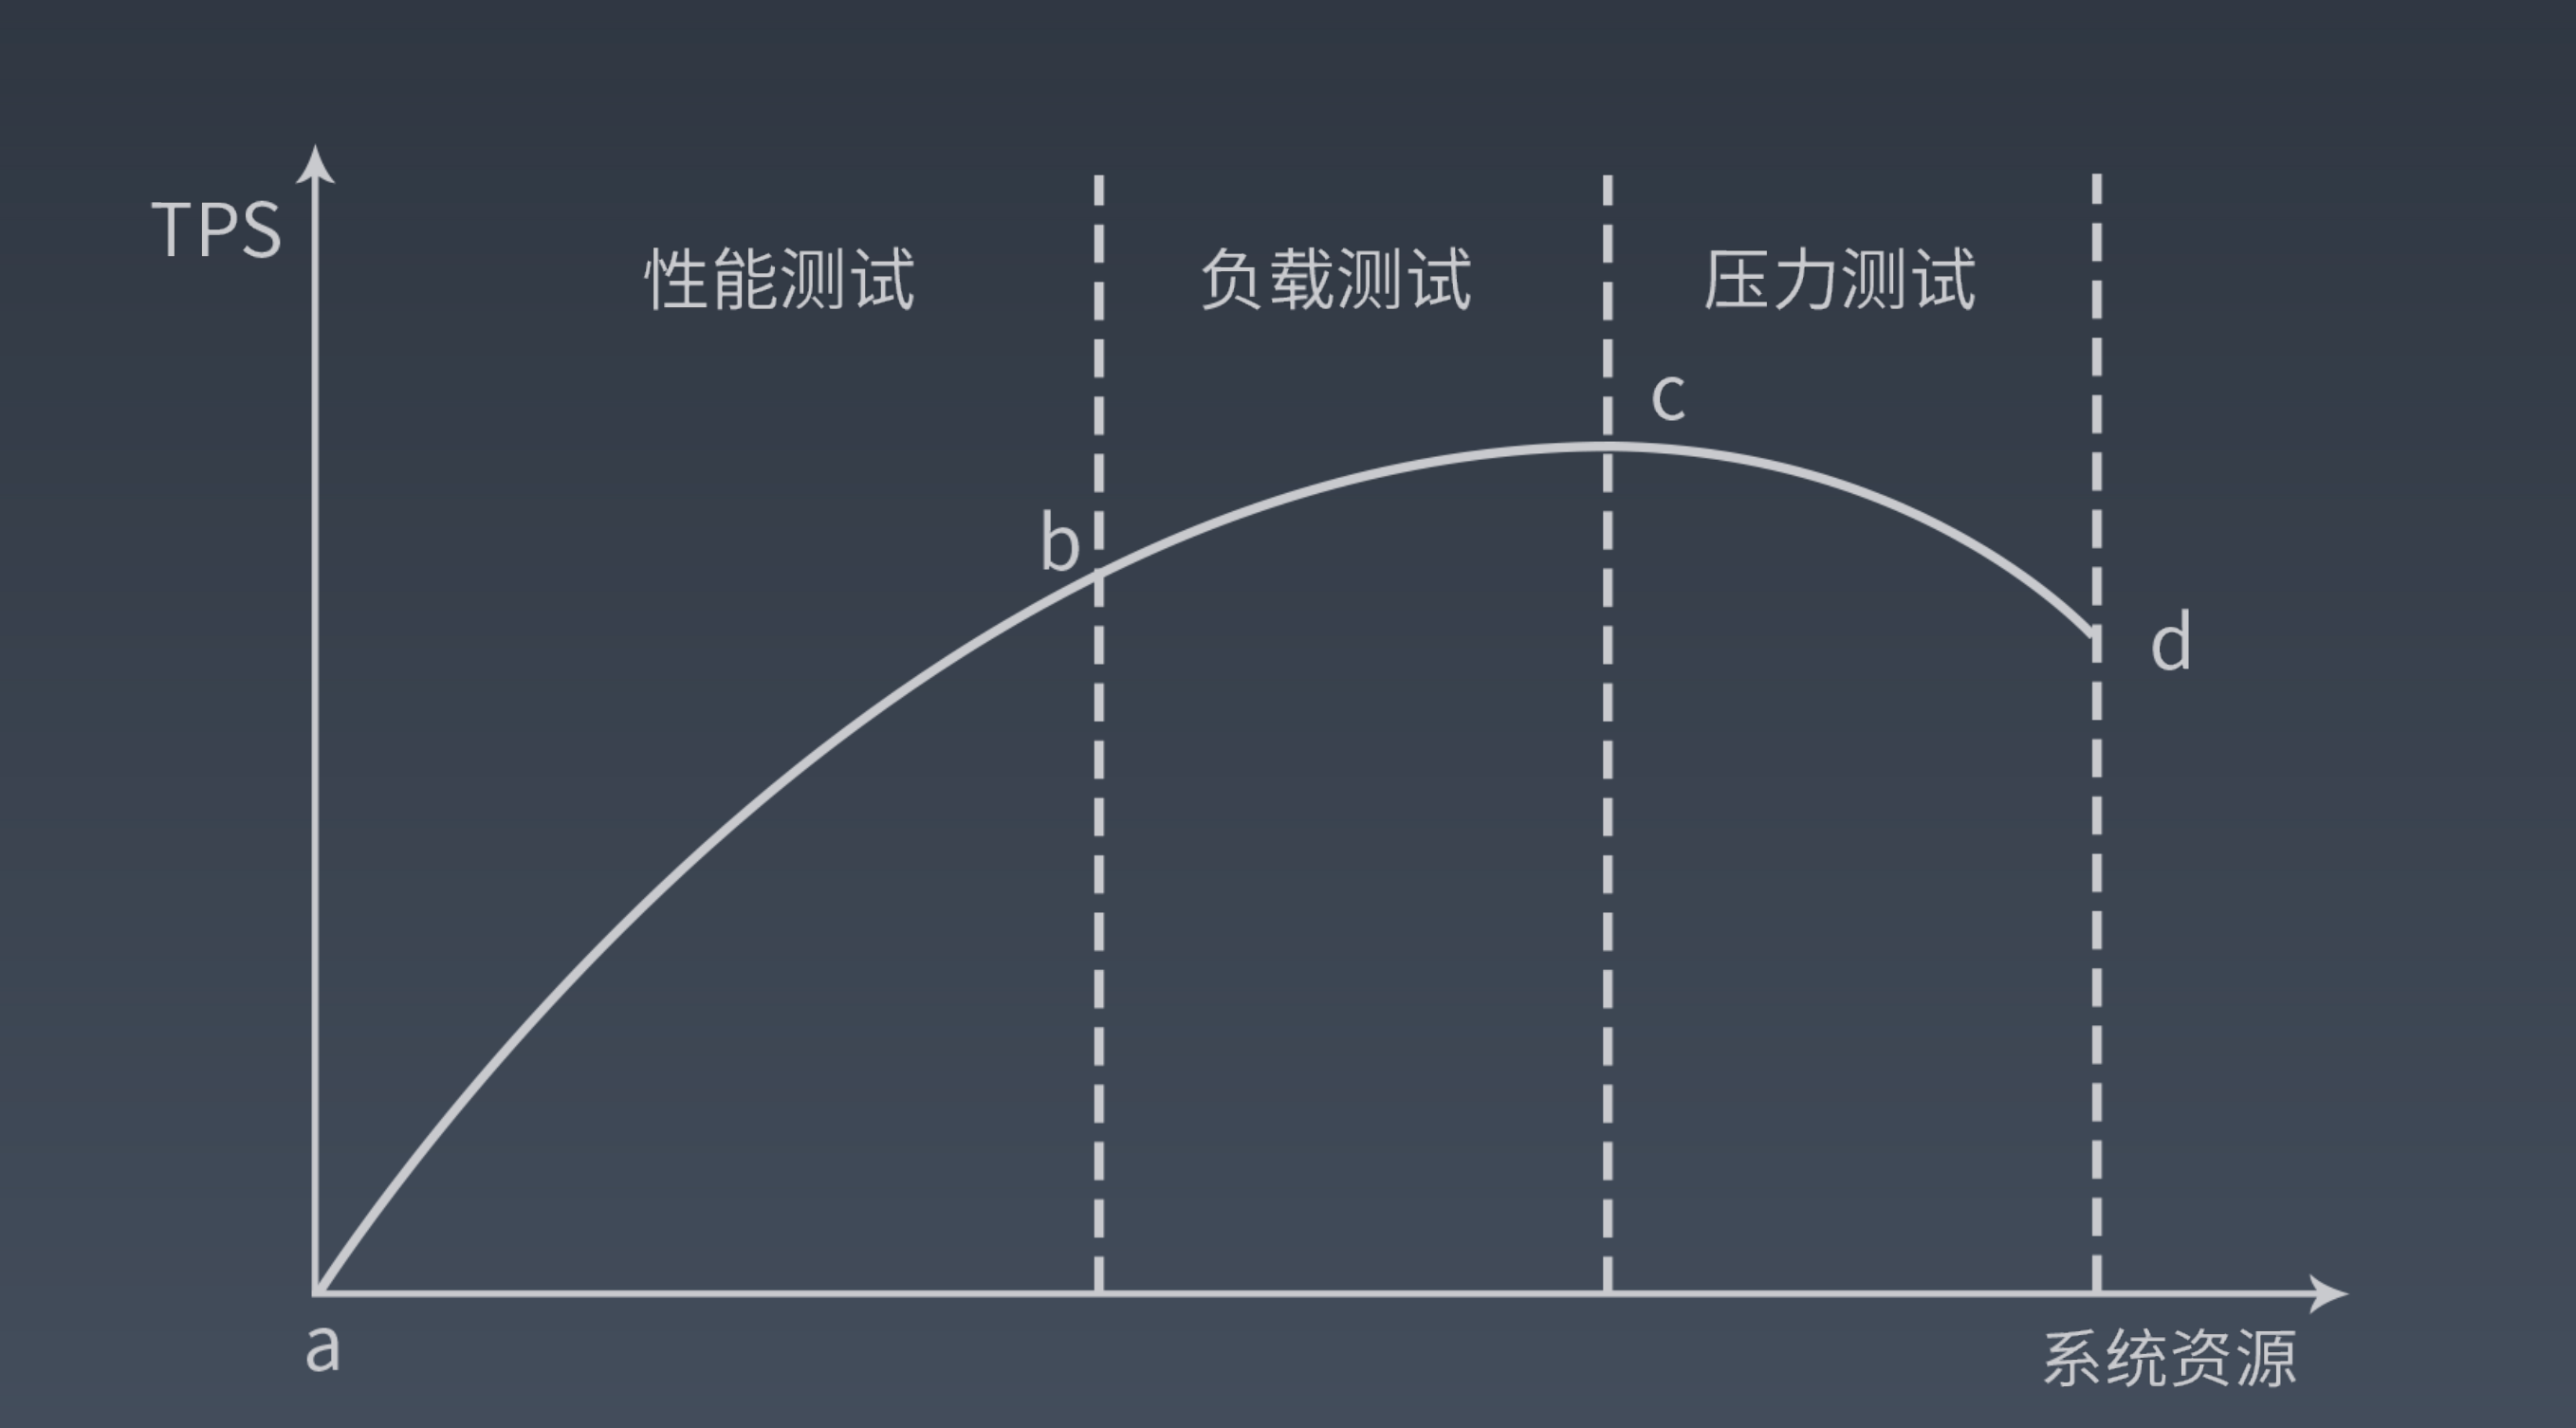
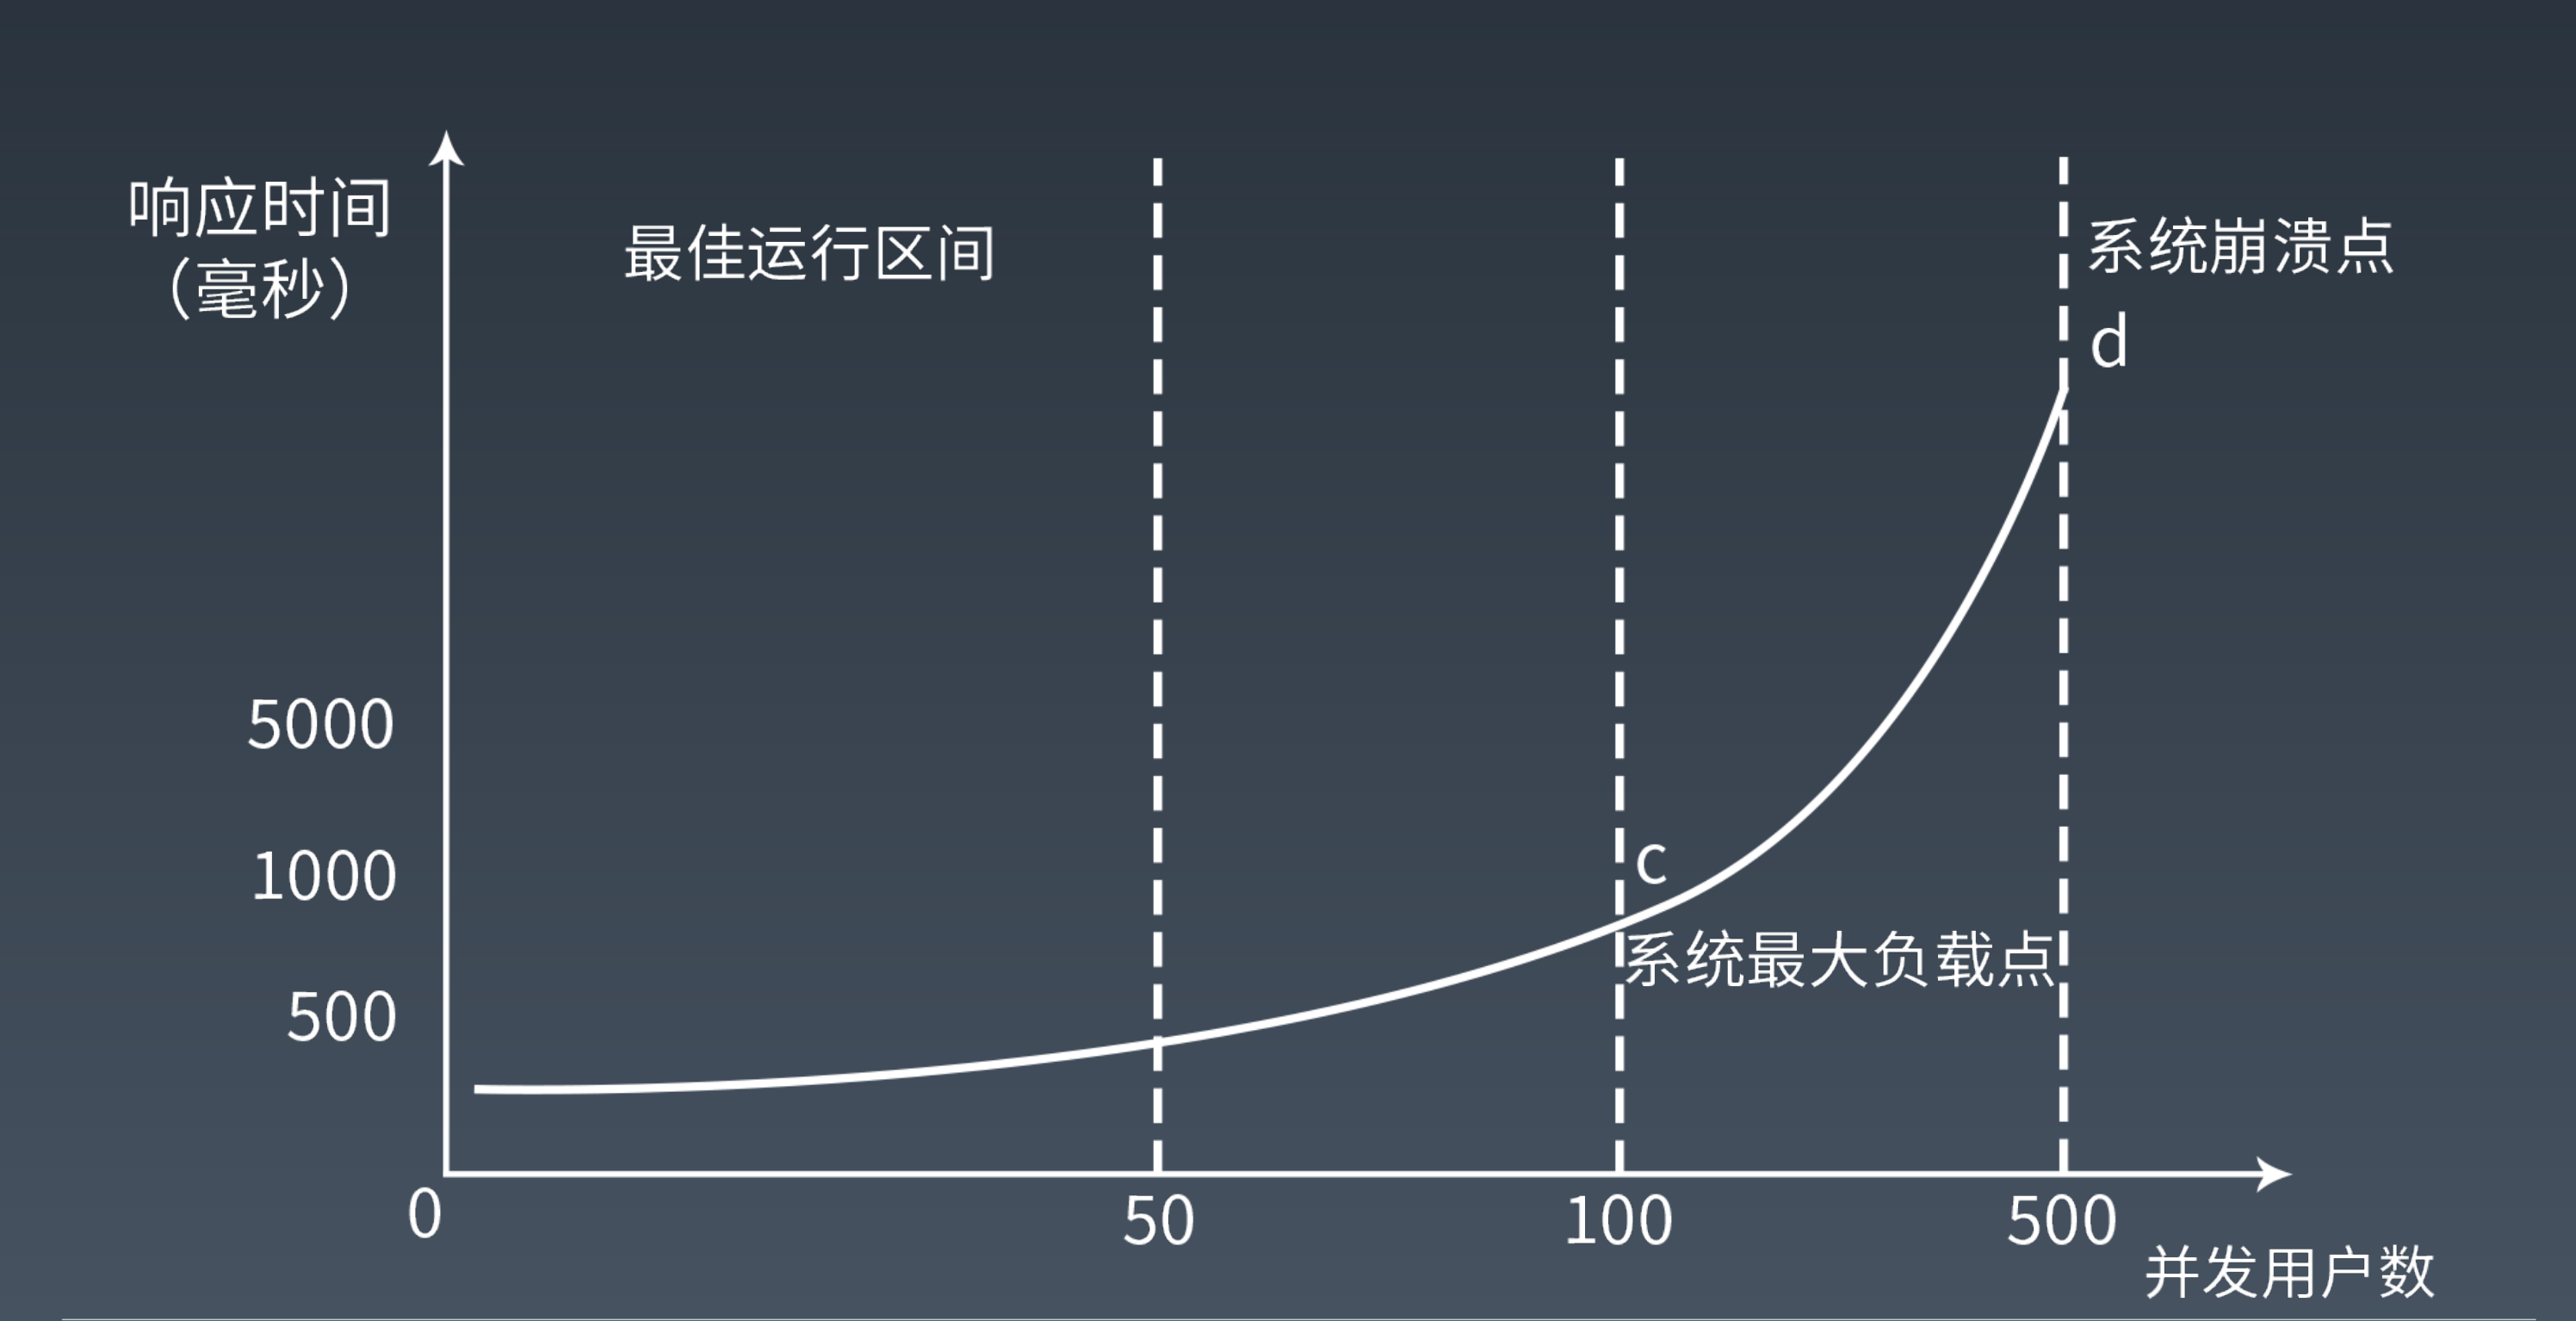
这是老师的ppt里提供的两个图。性能测试学习过程中,常见的图也包括下面这个
https://time.geekbang.org/column/article/178076
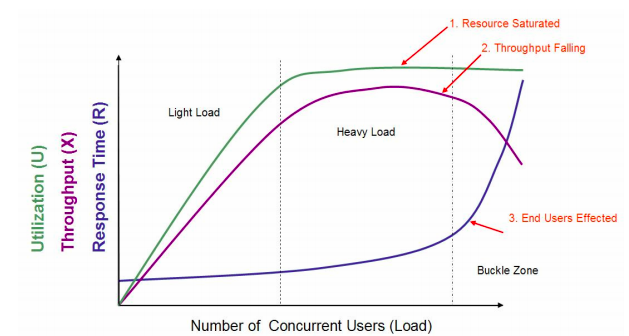
在这个图中,定义了三条曲线、三个区域、两个点以及三个状态描述。
三条曲线:吞吐量的曲线(紫色)、使用率 / 用户数曲线(绿色)、响应时间曲线(深蓝色)。
三个区域:轻负载区(Light Load)、重负载区(Heavy Load)、塌陷区(Buckle Zone)。
两个点:最优并发用户数(The Optimum Number of Concurrent Users)、最大并发用户数(The Maximum Number of Concurrent Users)。
三个状态描述:资源饱和(Resource Saturated)、吞吐下降(Throughput Falling)、用户受影响(End Users Effected)。
从图中可以看到,随着负载的增大,随着并发用户的增长,系统响应时间,吞吐率的变化。
当然,上图有一些不精确的地方,简化出另一个图形,以说明更直接一点的关系。如下所示:
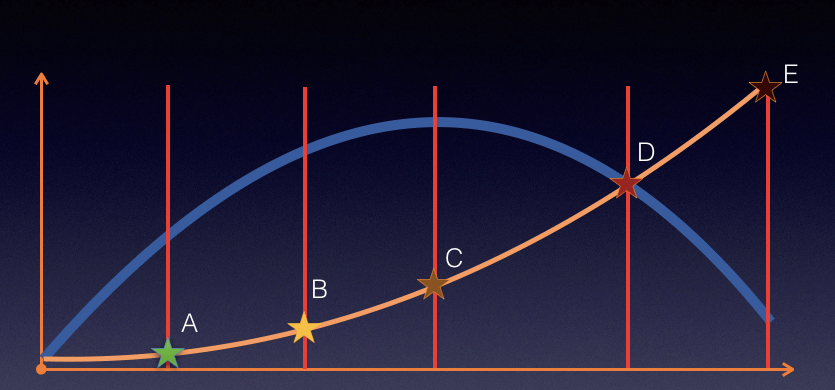
在 TPS 增加的过程中,响应时间一开始会处在较低的状态,也就是在 A 点之前。接着响应时间开始有些增加,直到业务可以承受的时间点 B,这时 TPS 仍然有增长的空间。再接着增加压力,达到 C 点时,达到最大 TPS。我们再接着增加压力,响应时间接着增加,但 TPS 会有下降(请注意,这里并不是必然的,有些系统在队列上处理得很好,会保持稳定的 TPS,然后多出来的请求都被友好拒绝)。最后,响应时间过长,达到了超时的程度
压测程序
时间比较紧张,参考https://github.com/danielzhou/goablite
go routine http.Get(*u) 获取结果
/*

 */

package main

import (
	"flag"
	"fmt"
	"net/http"
	"os"
	"runtime"
	"sync"
	"time"
)

// 参数
var (
	n = flag.Int("n", 2, "Number of requests to run.")
	c = flag.Int("c", 1, "Number of requests to run concurrently.\nTotal number of requests cannot be smaller than the concurrency level.")
	p = flag.Int("p", runtime.GOMAXPROCS(-1), "Number of used cpu cores")
	u = flag.String("u", "", "the url you want to connect.")
)

// 结果
var (
	success = 0.0
	failure = 0.0
	useTime = 0.0
)

// 帮助信息
var usage = `Usage: hey [options...] <url>

Options:
  -n  Number of requests to run. Default is 20.
  -c  Number of requests to run concurrently. Total number of requests cannot
      be smaller than the concurrency level. Default is 5.
  -p  Number of used cpu cores.(default for current machine is %d cores)
`

var wg sync.WaitGroup

// 主函数
func main() {
	flag.Usage = func() {
		fmt.Fprint(os.Stderr, fmt.Sprintf(usage, runtime.NumCPU()))
	}
	flag.Parse()

	// 判断参数是否正常
	if flag.NFlag() < 1 {
		usageAndExit("")
	}
	runtime.GOMAXPROCS(*p)
	num := *n
	conc := *c
	url := *u

	if url == "" || len(url) == 0 {
		usageAndExit("Please input the url you want to connect.")
	}
	if num <= 0 || conc <= 0 {
		usageAndExit("-n and -c cannot be smaller than 1.")
	}

	if num < conc {
		usageAndExit("-n cannot be less than -c.")
	}
	if *p > runtime.NumCPU() {
		fmt.Printf("your computer have %d CPU cores\n", runtime.NumCPU())
		usageAndExit("-p cannot bigger than that your computer have.")

	}

	startTime := time.Now().UnixNano()

	// 并发开始
	for i := 0; i < conc; i++ {
		wg.Add(1)
		go run(num / conc)
	}
	fmt.Println("主程序开始wait")
	wg.Wait()
	endTime := time.Now().UnixNano()
	useTime = float64(endTime-startTime) / 1e9

	// 输出结果
	fmt.Println("Plan_Total:", *n)
	fmt.Println("Concurrency Level:", *c)
	fmt.Println("CPU Core:", *p)
	fmt.Println()
	fmt.Println("Complete requests:", success)
	fmt.Println("Failed requests:", failure)
	// fmt.Println("SuccessRate:", fmt.Sprintf("%.2f", ((success/total)*100.0)), "%")
	fmt.Println("UseTime:", fmt.Sprintf("%.4f", useTime), "s")
	fmt.Println("Requests per second:", fmt.Sprintf("%.4f", float64(*n)/useTime))

}

// 运行每个客户端
func run(num int) {

	defer wg.Done()

	no := 0.0
	ok := 0.0

	for i := 0; i < num; i++ {
		resp, err := http.Get(*u)

		if err != nil {
			no += 1
			continue
		}

		defer resp.Body.Close()

		if resp.StatusCode != 200 {
			no += 1
			continue
		}

		ok += 1
		continue
	}

	success += ok
	failure += no
	// total += float64(num)

}

// 提示信息
func usageAndExit(msg string) {
	if msg != "" {
		fmt.Fprintf(os.Stderr, msg)
		fmt.Fprintf(os.Stderr, "\n\n")
	}
	flag.Usage()
	fmt.Fprintf(os.Stderr, "\n")
	os.Exit(1)
}
分别10并发和100并发,在100并发的时候部分返回结果错误,

100请求,10并发
Plan_Total: 100
Concurrency Level: 10
CPU Core: 4

Complete requests: 100
Failed requests: 0
UseTime: 31.7410 s
Requests per second: 3.1505
Exiting.

Debugger finished with exit code 0

200请求,100并发:

主程序开始wait
Plan_Total: 200
Concurrency Level: 100
CPU Core: 4

Complete requests: 185
Failed requests: 15
UseTime: 283.5817 s
Requests per second: 0.7053
Exiting.

Debugger finished with exit code 0
补一个java版本的
package com.zhk.metricscollections.request;

import lombok.Data;

/**
 * @author zhuhk
 * @create 2020-07-23 9:49 上午
 * @Version 1.0
 **/
@Data
public class RequestInfo {
    private String apiName;  // 扩展
    private double responseTime; //扩展
    private long timestamp;
}
package com.zhk.metricscollections.service;
import com.zhk.metricscollections.request.RequestInfo;
import java.io.IOException;
import org.apache.http.HttpEntity;
import org.apache.http.HttpResponse;
import org.apache.http.client.ClientProtocolException;
import org.apache.http.client.ResponseHandler;
import org.apache.http.client.methods.HttpGet;
import org.apache.http.impl.client.CloseableHttpClient;
import org.apache.http.impl.client.HttpClients;
import org.apache.http.util.EntityUtils;
/**
* @author zhuhk
* @create 2020-07-23 11:05 下午
* @Version 1.0
**/
public class HttpHandler {
public static RequestInfo doGet(String url) throws IOException {
RequestInfo requestInfo = new RequestInfo();
long start = System.currentTimeMillis();
CloseableHttpClient httpclient = HttpClients.createDefault();
try {
HttpGet httpget = new HttpGet(url);
System.out.println("Executing request " + httpget.getRequestLine());
// Create a custom response handler
ResponseHandler<String> responseHandler = new ResponseHandler<String>() {
@Override
public String handleResponse(
final HttpResponse response) throws ClientProtocolException, IOException {
int status = response.getStatusLine().getStatusCode();
if (status >= 200 && status < 300) {
HttpEntity entity = response.getEntity();
return entity != null ? EntityUtils.toString(entity) : null;
} else {
throw new ClientProtocolException("Unexpected response status: " + status);
}
}
};
String responseBody = httpclient.execute(httpget, responseHandler);
requestInfo.setTimestamp(System.currentTimeMillis() - start);
// System.out.println("----------------------------------------");
// System.out.println(responseBody);
} catch (ClientProtocolException e) {
e.printStackTrace();
} catch (IOException e) {
e.printStackTrace();
} finally {
httpclient.close();
}
return requestInfo;
}
}
package com.zhk.metricscollections.service;

import com.zhk.metricscollections.request.RequestInfo;

import java.io.IOException;
import java.util.ArrayList;
import java.util.List;
import java.util.Optional;
import java.util.concurrent.LinkedBlockingQueue;
import java.util.concurrent.ThreadPoolExecutor;
import java.util.concurrent.TimeUnit;
import java.util.stream.Collectors;
import java.util.stream.IntStream;

/**
 * @author zhuhk
 * @create 2020-07-24 7:29 上午
 * @Version 1.0
 **/
public class PressCreater {
    private int n = 1;
    private int c = 1;
    private String url;

    public PressCreater(int n, int c, String url) {
        this.n = n;
        this.c = c;
        this.url = url;
    }

    public List<RequestInfo> doPress() throws InterruptedException {
        List<RequestInfo> respList = new ArrayList<>();
        ThreadPoolExecutor executor = new ThreadPoolExecutor(c, c,
                0L, TimeUnit.MILLISECONDS,
                new LinkedBlockingQueue<Runnable>());

        IntStream.range(1,n).forEach(i -> {
            executor.execute(() -> {
                RequestInfo resp = null;
                try {
                    resp = HttpHandler.doGet(this.url);
                } catch (IOException e) {
                    e.printStackTrace();
                }
                respList.add(resp);
            });
        });
        while (executor.getActiveCount() > 0) {
            Thread.sleep(100);
        }
        executor.shutdown();
        return respList;
    }

    public long getAvgRespTime(List<RequestInfo> respList) {
        return Optional.ofNullable(respList).orElse(new ArrayList<>()).stream()
                .map(RequestInfo::getTimestamp)
                .collect(Collectors.averagingLong(Long::longValue)).longValue();
    }

    public long getAvgRespTime(List<RequestInfo> respList, int percent) {
        long avgRespTime = 0L;
        Optional<List<RequestInfo>> respTimesOptional = Optional.ofNullable(respList);
        if (respTimesOptional.isPresent()) {
            avgRespTime = respTimesOptional.get().stream()
                    .map(RequestInfo::getTimestamp)
                    .sorted()
                    .collect(Collectors.toList())
                    .get(Math.max(Math.floorDiv(respList.size() * percent, 100) - 1, 0));
        }
        return avgRespTime;
    }

    public void print(List<RequestInfo> respList) {
        System.out.println(String.format("并发 %d 访问 %s,总计访问 %d 次,压测结果:", this.c, this.url, this.n));
        System.out.println(String.format("平均响应时间: %d ms", this.getAvgRespTime(respList)));
        System.out.println(String.format("95%s响应时间: %d ms", "%", this.getAvgRespTime(respList, 95)));
    }
}
package com.zhk.metricscollections.service;

import com.zhk.metricscollections.request.RequestInfo;
import org.junit.jupiter.api.Test;

import java.util.List;

class PressCreaterTest {

    @Test
    public void testPressCeater() throws InterruptedException {
        String url = "http://www.baidu.com";
        int c = 10;
        int n = 100;
        PressCreater pressCreater = new PressCreater(n, c, url);
        List<RequestInfo> respList = pressCreater.doPress();
        pressCreater.print(respList);
    }
}
并发 10 访问 http://www.baidu.com,总计访问 100 次,压测结果:
平均响应时间: 1462 ms
95%响应时间: 7657 ms